Monitoring GPUs on Slurm-Based Clusters: A Practical Guide
Monitoring GPU resources on Slurm-based clusters is essential for efficient resource allocation, debugging performance bottlenecks, and ensuring optimal workload distribution. This guide covers terminal-based tools for both NVIDIA and AMD GPUs, demonstrating how to use them in environments where you may not have graphical interfaces or direct hardware access.
Why Monitor GPUs on Slurm Clusters?
In a Slurm-managed environment, multiple users share GPU resources. Without proper monitoring, you risk:
- Overutilization of specific GPUs
- Resource starvation for competing jobs
- Difficulty identifying performance degradation
- Wasted compute cycles on idle or underutilized GPUs
Monitoring tools help diagnose these issues before they impact your workflow.
NVIDIA GPU Monitoring
1. nvidia-smi
nvidia-smi is NVIDIA’s official command-line utility for monitoring and managing NVIDIA GPUs. It provides critical hardware and usage information, including temperature, power consumption, memory usage, and compute utilization.
Basic Usage
nvidia-smiThis command displays a concise overview of GPU status, including:
- GPU model and UUID
- Driver version
- Persistence mode status
- Bus ID and PCI address
- Temperature, power usage, and memory consumption
- Compute utilization and processes using the GPU
Example output:
+-----------------------------------------------------------------------------------------+
| NVIDIA-SMI 580.95.05              Driver Version: 580.95.05      CUDA Version: 13.0     |
+-----------------------------------------+------------------------+----------------------+
| GPU  Name                 Persistence-M | Bus-Id          Disp.A | Volatile Uncorr. ECC |
| Fan  Temp   Perf          Pwr:Usage/Cap |           Memory-Usage | GPU-Util  Compute M. |
|                                         |                        |               MIG M. |
|=========================================+========================+======================|
|   0  NVIDIA H200                    On  |   00000000:04:00.0 Off |                    0 |
| N/A   55C    P0            138W /  700W |    9247MiB / 143771MiB |      0%      Default |
|                                         |                        |             Disabled |
+-----------------------------------------+------------------------+----------------------+
|   1  NVIDIA H200                    On  |   00000000:14:00.0 Off |                    0 |
| N/A   55C    P0            139W /  700W |    8885MiB / 143771MiB |      0%      Default |
|                                         |                        |             Disabled |
+-----------------------------------------+------------------------+----------------------+
|   2  NVIDIA H200                    On  |   00000000:64:00.0 Off |                    0 |
| N/A   61C    P0            139W /  700W |    9589MiB / 143771MiB |      0%      Default |
|                                         |                        |             Disabled |
+-----------------------------------------+------------------------+----------------------+
|   3  NVIDIA H200                    On  |   00000000:74:00.0 Off |                    0 |
| N/A   52C    P0             86W /  700W |       0MiB / 143771MiB |      0%      Default |
|                                         |                        |             Disabled |
+-----------------------------------------+------------------------+----------------------+

[...output truncated...]

+-----------------------------------------------------------------------------------------+
| Processes:                                                                              |
|  GPU   GI   CI              PID   Type   Process name                        GPU Memory |
|        ID   ID                                                               Usage      |
|=========================================================================================|
|    0   N/A  N/A         2483367      C   python3                                9238MiB |
|    1   N/A  N/A         2483364      C   python3                                8876MiB |
|    2   N/A  N/A         2483366      C   python3                                9580MiB |

[...output truncated...]

+-----------------------------------------------------------------------------------------+
Continuous Monitoring
To monitor GPU metrics in real-time:
nvidia-smi -l 1This refreshes the display every second, providing a dynamic view of GPU utilization.
Specific Metrics
For detailed memory and compute usage:
nvidia-smi --query-gpu=index,name,pci_bus_id,memory.used,memory.total,power.draw,temperature.gpu --format=csvThis command outputs a CSV-formatted table with selected metrics, useful for piping to other tools or parsing in scripts.
Filtering by GPU
If you have multiple GPUs and want data for a specific one:
nvidia-smi -i 0Replace 0 with the GPU index you want to monitor.
2. nvtop
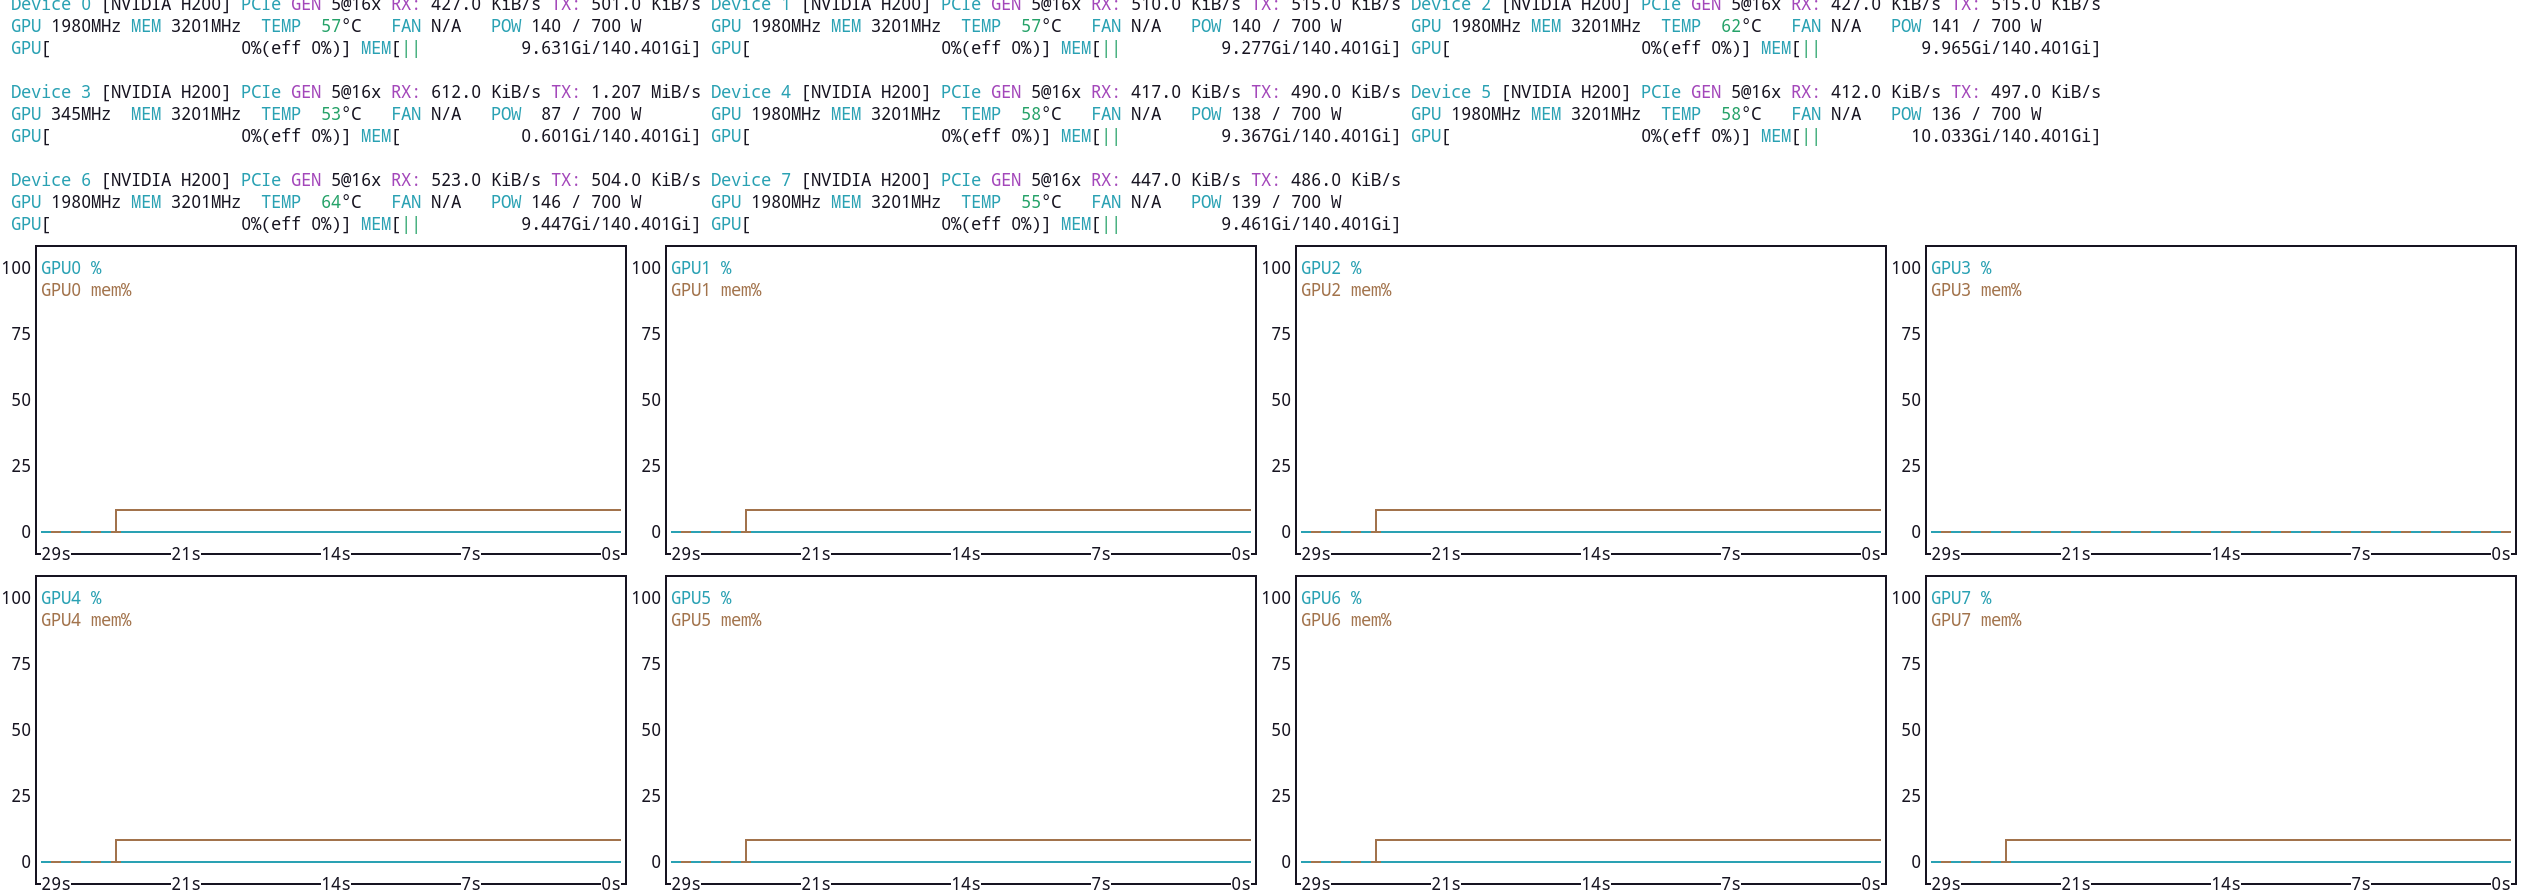
nvtop is an interactive top-like tool for NVIDIA GPUs. It provides a more user-friendly, real-time view of GPU utilization compared to nvidia-smi.
nvtopThis launches an interactive terminal interface showing:
- GPU model and index
- Memory usage (used/total)
- GPU utilization percentage
- Running processes and their resource consumption
- Temperature, power, and clock speeds
Sample interface display (note: when there’s user’s activity, it will be also shown below the bar graph):
Keybindings
- Arrow keys: Navigate between GPUs
- Tab: Switch between panels
- Q: Quit
- R: Reset statistics
- M: Toggle memory/process view
nvtop is also capable of producing output in JSON format when combined with the -s option (more useful for scripting):
[
  {
    "device_name": "NVIDIA H200",
    "gpu_clock": "1980MHz",
    "mem_clock": "3201MHz",
    "temp": "56C",
    "fan_speed": null,
    "power_draw": "139W",
    "gpu_util": "20%",
    "encode": "0%",
    "decode": "0%",
    "mem_util": "6%",
    "mem_total": "150754820096",
    "mem_used": "10340859904",
    "mem_free": "140413960192",
    "processes": [
      {
        "pid": "2483367",
        "cmdline": "python3 my_gpu_code.py",
        "kind": "compute",
        "user": "user_ab",
        "gpu_usage": null,
        "gpu_mem_bytes_alloc": "9686745088",
        "gpu_mem_usage": "6%",
        "encode": null,
        "decode": null
      }
    ]
  },

[...output truncated...]
Monitoring Multiple GPUs
nvtop automatically detects all available NVIDIA GPUs and displays them in separate tabs or sections, depending on your terminal width.
For Slurm cluster usage, this helps identify:
- Which GPUs are available for new jobs
- Resource distribution across your allocation
- Potential contention issues with other users’ jobs
AMD GPU Monitoring
1. amd-smi
amd-smi is AMD’s equivalent to nvidia-smi, providing comprehensive monitoring capabilities for AMD GPUs.
Basic Usage
amd-smiThis displays an overview of AMD GPU status, including:
- GPU model and temperature
- Power consumption and utilization
- Memory usage and clock speeds
- Running processes and their resource consumption
- ECC error counts (if supported)
Example output structure (format varies by GPU model):
+------------------------------------------------------------------------------+
| AMD-SMI 26.2.2+671d39a71e    amdgpu version: 6.16.13  ROCm version: 7.2.2    |
| VBIOS version: 531249                                                        |
| Platform: Linux Baremetal                                                    |
|-------------------------------------+----------------------------------------|
| BDF                        GPU-Name | Mem-Uti   Temp   UEC       Power-Usage |
| GPU  HIP-ID  OAM-ID  Partition-Mode | GFX-Uti    Fan               Mem-Usage |
|=====================================+========================================|
| 0000:03:00.0     AMD Instinct MI100 | 0 %      50 °C   0            37/290 W |
|   0       2     N/A             N/A | 0 %        N/A              6/32752 MB |
|-------------------------------------+----------------------------------------|
| 0000:27:00.0     AMD Instinct MI100 | 0 %      47 °C   0            39/290 W |
|   1       3     N/A             N/A | 0 %        N/A              6/32752 MB |
|-------------------------------------+----------------------------------------|
| 0000:43:00.0     AMD Instinct MI100 | 0 %      47 °C   0            34/290 W |
|   2       1     N/A             N/A | 0 %        N/A              6/32752 MB |
|-------------------------------------+----------------------------------------|

[...output truncated...]

+------------------------------------------------------------------------------+
| Processes:                                                                   |
|  GPU        PID  Process Name          GTT_MEM  VRAM_MEM  MEM_USAGE     CU % |
|==============================================================================|
|  No running processes found                                                  |
+------------------------------------------------------------------------------+
Detailed Querying
Summarized hardware status of all GPUs:
amd-smi monitorGPU XCP POWER GPU_T MEM_T GFX_CLK GFX% MEM% ENC% DEC% VRAM_USAGE
0 0 34 W 50 °C 42 °C 300 MHz 0 % 0 % N/A 0 % 0.0/ 32.0 GB
1 0 39 W 47 °C 43 °C 300 MHz 0 % 0 % N/A 0 % 0.0/ 32.0 GB
2 0 34 W 47 °C 45 °C 300 MHz 0 % 0 % N/A 0 % 0.0/ 32.0 GB
3 0 34 W 43 °C 40 °C 300 MHz 0 % 0 % N/A 0 % 0.0/ 32.0 GB
4 0 39 W 44 °C 42 °C 300 MHz 0 % 0 % N/A 0 % 0.0/ 32.0 GB
5 0 34 W 43 °C 41 °C 300 MHz 0 % 0 % N/A 0 % 0.0/ 32.0 GB
6 0 34 W 44 °C 40 °C 300 MHz 0 % 0 % N/A 0 % 0.0/ 32.0 GB
7 0 34 W 44 °C 42 °C 300 MHz 0 % 0 % N/A 0 % 0.0/ 32.0 GBContinuous Monitoring
To monitor AMD GPU metrics continuously:
watch -n 15 amd-smiThis runs amd-smi every fifteen seconds, providing real-time updates.
2. amdgpu_top
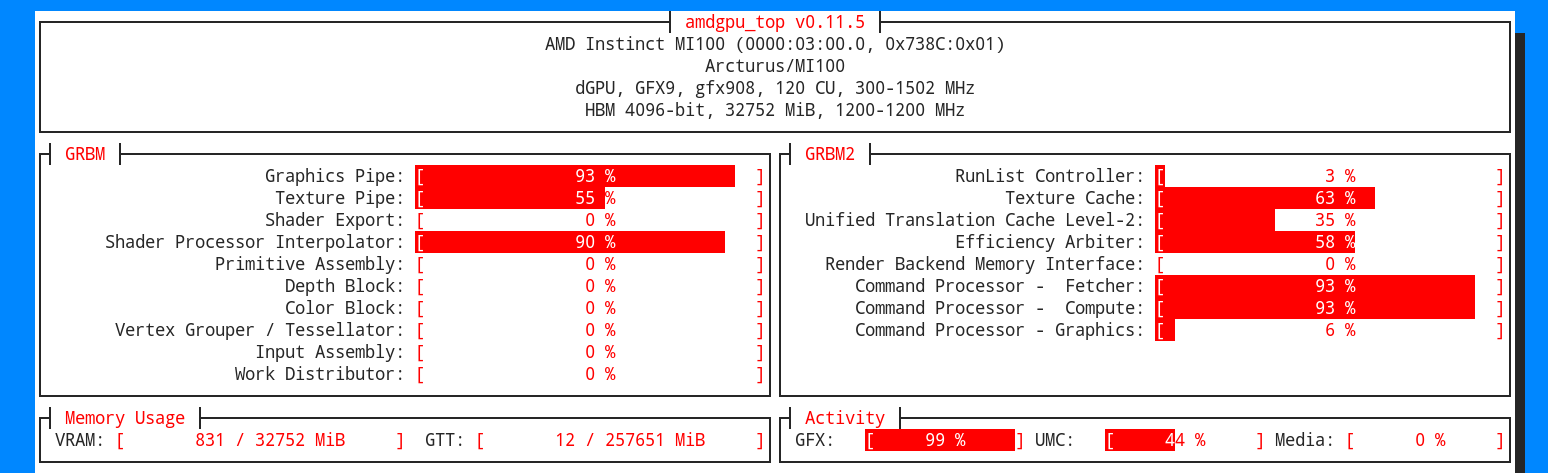
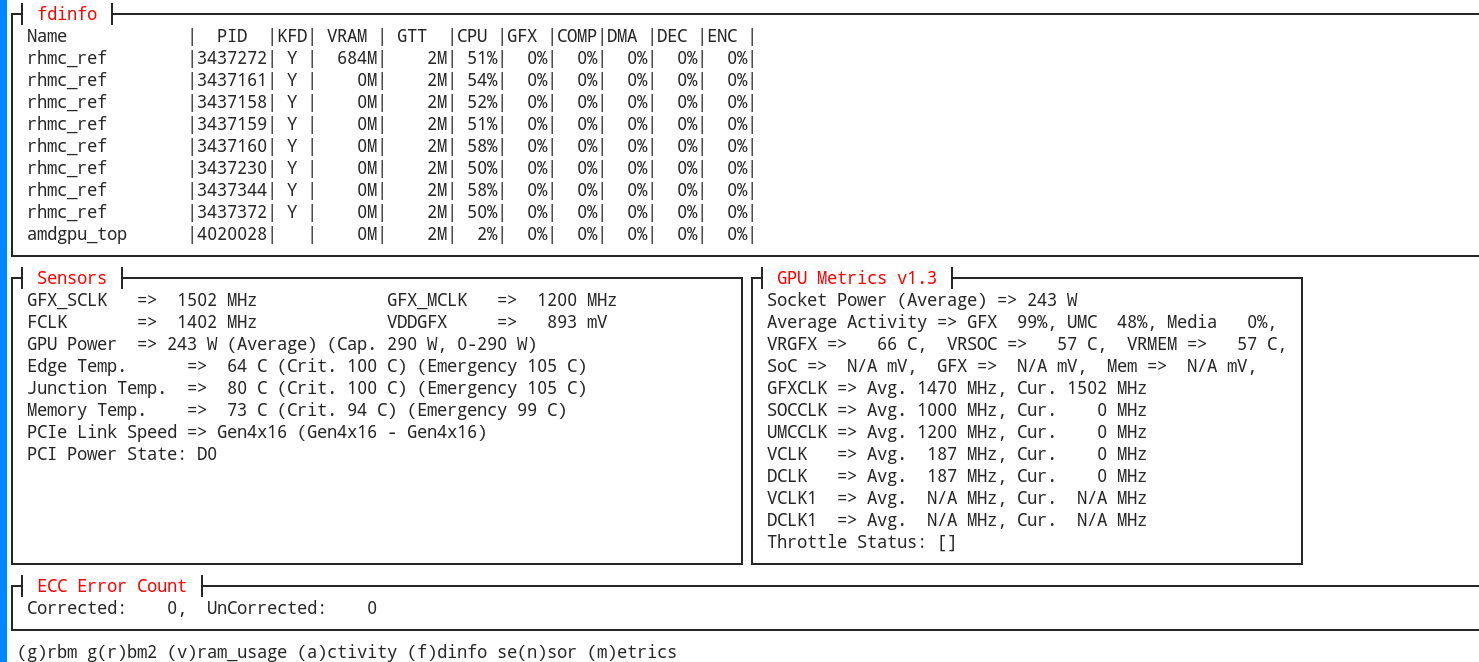
amdgpu_top is an interactive monitoring tool similar to nvtop, specifically designed for AMD GPUs. It provides detailed real-time information about AMD GPU utilization and performance.
Basic Usage
amdgpu_topThe interface shows:
- GPU model and temperature
- Memory usage (VRAM and VRAM+GTT)
- GPU and memory utilization
- Running processes and their resource consumption
- Clock speeds and power usage
Sample display:
Command Line Options
For scripting or non-interactive use:
amdgpu_top -d 0 -s 1-d: GPU device index (usually 0 for primary GPU)-s: Sampling interval in seconds
Monitoring Slurm Jobs
On Slurm clusters, amdgpu_top helps identify:
- Available AMD GPUs in your allocation
- Resource utilization patterns
- Potential performance bottlenecks
- Memory usage by different processes
Integrating with Slurm
GPU monitoring tools integrate seamlessly with Slurm workflows:
1. GPU-Aware Slurm Commands
Use squeue with GPU filtering:
squeue --me --format="%.18i %.9P %.8j %.8u %.2t %.10M %.6D %R %N %b"This shows jobs with GPU resources allocated, including node and GPU type information.
2. Checking GPU Allocation
After submitting a Slurm job, verify your GPU allocation:
scontrol show job <jobid> | grep -i gpu3. Monitoring Running Jobs
For allocated jobs in Slurm allocations:
srun --jobid=<jobid> nvidia-smi

srun --jobid=<jobid> amdgpu_top
These commands run within the Slurm allocation context, providing job-specific GPU monitoring.
4. Batch Monitoring Scripts
Create monitoring scripts for Slurm arrays or multi-GPU jobs:
#!/bin/bash
#SBATCH --job-name=gpu_monitor
#SBATCH --output=gpu_monitor_%j.log
#SBATCH --ntasks=1
#SBATCH --time=01:00:00

# Start continuous monitoring
nvidia-smi -l 1 > gpu_metrics_${SLURM_JOBID}.log &

# Your actual job here
python your_gpu_code.py

# Kill monitoring when job completes
kill $!
5. Node-Level Monitoring
Use Slurm’s node-exclusive allocations for precise GPU monitoring:
#SBATCH --nodes=1
#SBATCH --ntasks-per-node=1
#SBATCH --gres=gpu:2  # Allocate 2 GPUs

# Your monitoring commands here, they'll show all GPUs on the node
Best Practices and Common Patterns
1. Job Profiling Strategy
Regular monitoring reveals GPU usage patterns:
# Profile GPU usage throughout your job
for i in {1..60}; do
    nvidia-smi -q -i 0 | grep "Utilization" >> utilization_profile.log
    sleep 60
    echo "=====" >> utilization_profile.log
done
2. Identifying Resource Contention
Monitor GPU utilization during different phases of your job to detect contention:
watch -n 5 "nvidia-smi | grep -A 5 Utilization"3. Validating GPU Allocation
Verify that your Slurm job received the expected GPUs:
srun nvidia-smi -LThis shows all GPUs available on the node, confirming your allocation.
4. Memory Leak Detection
Monitor VRAM usage for memory leaks:
srun watch -n 2 "nvidia-smi -q -i 0 | grep -A 3 Memory"5. Power and Temperature Alerting
Monitor GPU power and temperature for potential thermal throttling:
srun nvidia-smi -q -i 0 | grep -E "Temperature|Power Draw"Troubleshooting Common Issues
1. High Memory Usage Without Process
Sometimes GPUs show memory usage but no associated processes:
# Identify the PID using the memory
nvidia-smi

# Check for zombie processes or system processes
ps aux | grep <suspect_pid>
2. Performance Bottlenecks
Use monitoring to identify performance issues:
# Monitor GPU utilization during execution
nvidia-smi --query-gpu=utilization.gpu,utilization.memory,memory.used --loop=continuous

# Look for:
# - Low GPU utilization with high memory usage (memory-bound)
# - High GPU utilization with low memory (compute-bound)
# - Memory usage growing unexpectedly (potential leak)
3. Slurm Configuration Issues
Verify GPU resource manager configuration in Slurm:
# Check available GPUs on compute nodes
sinfo -o "%N %G"

# Verify GPU types are correctly defined
scontrol show node <nodename> | grep -i gpu
Advanced Scenarios
1. Multi-GPU Jobs
For jobs utilizing multiple GPUs, monitor each device individually:
for gpu_id in $(seq 0 3); do
    echo "Monitoring GPU $gpu_id:"
    nvidia-smi -i $gpu_id -q | grep -A 3 "Utilization"
done
2. Cross-Platform Monitoring
On clusters with mixed NVIDIA/AMD GPUs, use conditional monitoring:
# In your job script or monitoring wrapper
if command -v nvidia-smi &> /dev/null; then
    echo "NVIDIA GPUs detected:"
    nvidia-smi -L
    nvidia-smi --query-gpu=utilization.gpu --format=csv
elif command -v amd-smi &> /dev/null; then
    echo "AMD GPUs detected:"
    amd-smi -i 0 | grep -A 5 "GPU"
fi
3. Automated Resource Reporting
Create automated reporting for job completion:
#!/bin/bash
#SBATCH --job-name=gpu_report
#SBATCH --output=job_%j_gpu_report.txt

# Start GPU monitoring
nvidia-smi -l 1 > /tmp/gpu_monitor_${SLURM_JOBID}.log &
MONITOR_PID=$!

# Run your job
python your_compute_intensive_job.py

# Generate report at job end
kill $MONITOR_PID
{
    echo "GPU Monitoring Report for Job ${SLURM_JOBID}"
    echo "============================================="
    echo ""
    echo "Job Summary:"
    scontrol show job ${SLURM_JOBID} | grep -v "^   "
    echo ""
    echo "GPU Metrics During Job:"
    cat /tmp/gpu_monitor_${SLURM_JOBID}.log | tail -n 50
    echo ""
    echo "Peak Usage Statistcs:"
    grep "Utilization" /tmp/gpu_monitor_${SLURM_JOBID}.log | tail -n 1
} > job_${SLURM_JOBID}_gpu_report.txt
Conclusion
Effective GPU monitoring on Slurm-based clusters enables better resource utilization, faster debugging, and more predictable job performance. The tools covered in this guide provide comprehensive insight into GPU utilization across NVIDIA and AMD hardware.
Integration with Slurm workflows allows seamless monitoring within job contexts, while batch scripts and automated reporting provide valuable data for optimizing future allocations and workloads.
By adopting these monitoring practices, researchers and engineers can maximize GPU efficiency, reduce time-to-results, and improve the reliability of GPU-accelerated computations in shared cluster environments.